Reviewing a private-equity deal is a long, multi-step analytical task, and increasingly one we ask LLM agents to take on: read the deal memo against the financial model behind it, judge whether the two hold together, and recommend whether to invest. In our evaluation on DealTrace, we find that failures concentrate in specific stages of the process, with the greatest impact arising from forecasting future periods, and a further share from correctly extracting the relevant information at the start of the analysis to ensure coverage. Interestingly, the benefit of inserting a critic into the process is not universal, contradicting some past findings: running the critic adds a notable cost while producing little positive effect, and in some cases lowers the performance of the model. The effect of scaffolding, by contrast, was consistent and positive across metrics and across all tested LLMs. Our testing also shows that the gaps in performance arise specifically from forecasting quality, the stage all models struggle with the most and the capability that most needs to improve for models to handle work of this kind.
Task setting
DealTrace is built from ten real private-equity and M&A deal packages, the kind an analyst actually receives: a confidential memo or management presentation, the companion Excel model, and, for some deals, extra disclosures. Two things make it hard. The narrative and the model do not always agree, since a memo is a selling document whose headline claims need not tie to the workbook, so part of the task is finding the gaps. And the number that matters is rarely stated; it has to be read from one cell among thousands or computed from several, so part of the task is locating the evidence, not just using it.
The agent reaches the package through two read-only tools, a spreadsheet tool and a document tool, and must produce a single output: an investment recommendation for the committee. It is a long-horizon task, and we score the whole path to that recommendation rather than the recommendation alone, because staging a long reasoning chain is what lets a failure be attributed to the step that produced it, and because it mirrors the order in which an analyst actually works the deal. The task therefore runs as five stages that follow the analyst's decision, extract, reconcile, forecast, market, and recommend, each exercising a distinct capability and feeding the next. Every stage emits a typed, citable artifact, and every clause of the recommendation cites the upstream items it rests on, so the chain stays traceable end to end.
Results
Metrics
Most finance benchmarks score the final answer, or grade open-ended prose with a single LLM judge, and neither recovers a comprehensive picture of where a long analysis broke. A purely deterministic score cannot read the stages that require judgment; an LLM judge in isolation tends toward relatively uniform scores that miss the nuances of model behavior, even when given a detailed rubric, and it carries position and verbosity biases of its own. The diagnostic signal comes instead from a defined mix of measurement types: deterministic checks against the structured artifacts where they exist, an LLM judge confined to the open-ended stages and anchored to cited evidence rather than to its own prior, and coverage reported beside accuracy so that no single weakness is absorbed into an aggregate score.
Each deal carries a curated ground truth, built once and reused across conditions: the value of every masked forecast cell, the known narrative-versus-model discrepancies, the critical memo facts, and the workbook. A deterministic layer grades everything decidable without judgment, reading the cited cell or page and comparing values, and reports per stage: extraction and reconciliation precision, forecast accuracy with coverage, grounding, and risk propagation. A non-deterministic layer grades the open-ended market and recommendation stages with a fixed model judge that sees each claim next to the evidence it cites and scores whether the claim follows from that evidence, not from its own prior. Coverage sits next to accuracy throughout, so a model cannot look strong by predicting only the easy cells.
Conditions
Each model runs under three conditions that change only the scaffolding around the five stages, never the task, which is how we separate what a model can do on its own from what the harness does for it. Unguided gives the task and the tools but no schema or method. Outline adds the canonical fields and staged guidance. Outline + critique adds one self-critique pass that flags unsupported claims and blank forecast cells, after which the model revises once.
Overall performance
We evaluate Claude Opus 4.7, GPT-5.5, and Gemini 3.1 Pro across all ten deals and three conditions, with the judge fixed at Claude Opus 4.7. GPT-5.5 is strongest on both the judge score and deterministic accuracy and Gemini 3.1 Pro weakest; the between-model differences are significant (judge F = 5.07, p = 0.007; accuracy F = 24.1, p < 0.001). Since the judge is Opus and ranks Opus below GPT-5.5, the ordering is not self-preference. Within each model the three conditions do not differ significantly on the judge score (every within-model ANOVA returns p > 0.2).
LLM-as-judge score (0 to 100) and overall auto-graded accuracy (percent), mean and standard deviation across the ten deals, by model and condition. Ung. is unguided, Out. is outline, O+C is outline + critique. Within each model the conditions do not differ significantly on either metric.
The two metrics do not move together, which is why we report both. They agree on model ranking but disagree on conditions: Gemini's accuracy falls from 67.0 to 63.3 as its judge score rises from 42.9 to 48.9. The standard deviations are wide relative to the gaps, so the condition effects on the verdict are within noise.
Forecasting by model and condition, mean across the ten deals, as percentages except forecast quality. Targeted accuracy is the share of standardized cells within five percent; average misalignment is the mean absolute percent error, which is large and heavy-tailed; coverage is the share of the grid predicted at all; non-target accuracy is the within-five-percent rate over every predicted cell with a workbook value; forecast quality is 0.8 times targeted accuracy plus 0.2 times non-target accuracy.
Forecasting shows the same pattern. Coverage and targeted accuracy rise sharply under scaffolding, but average misalignment stays in the high double and triple digits, so predicted cells are often gross misses. Non-target accuracy exceeds targeted accuracy in places (GPT-5.5 unguided, 61.4 against 8.0) because a model is more accurate on the cells it chooses than on the required grid, a selection effect coverage exposes.
Interventions
In building DealTrace, our aim was an empirically grounded account of what drives the final outcome, one that can be decomposed, traced back to a stage, and demonstrated rather than asserted, which to our knowledge has not been done for a task of this length. Provenance localizes where a recommendation comes from; the interventions then test whether a localized stage is actually consequential, and they assess each stage in two directions. A knockout removes one stage and re-runs the rest, measuring what the verdict loses without it. A repair supplies the model with ground truth for its upstream stages, one at a time, measuring what the verdict gains when that stage is handed in correct. Each stage corresponds to a behavioral question, whether the model can extract, reconcile, forecast, and ground a claim, and the two directions together convert a correlation between a stage metric and the verdict into a measured effect of changing that stage.
Which stages drive the judge score
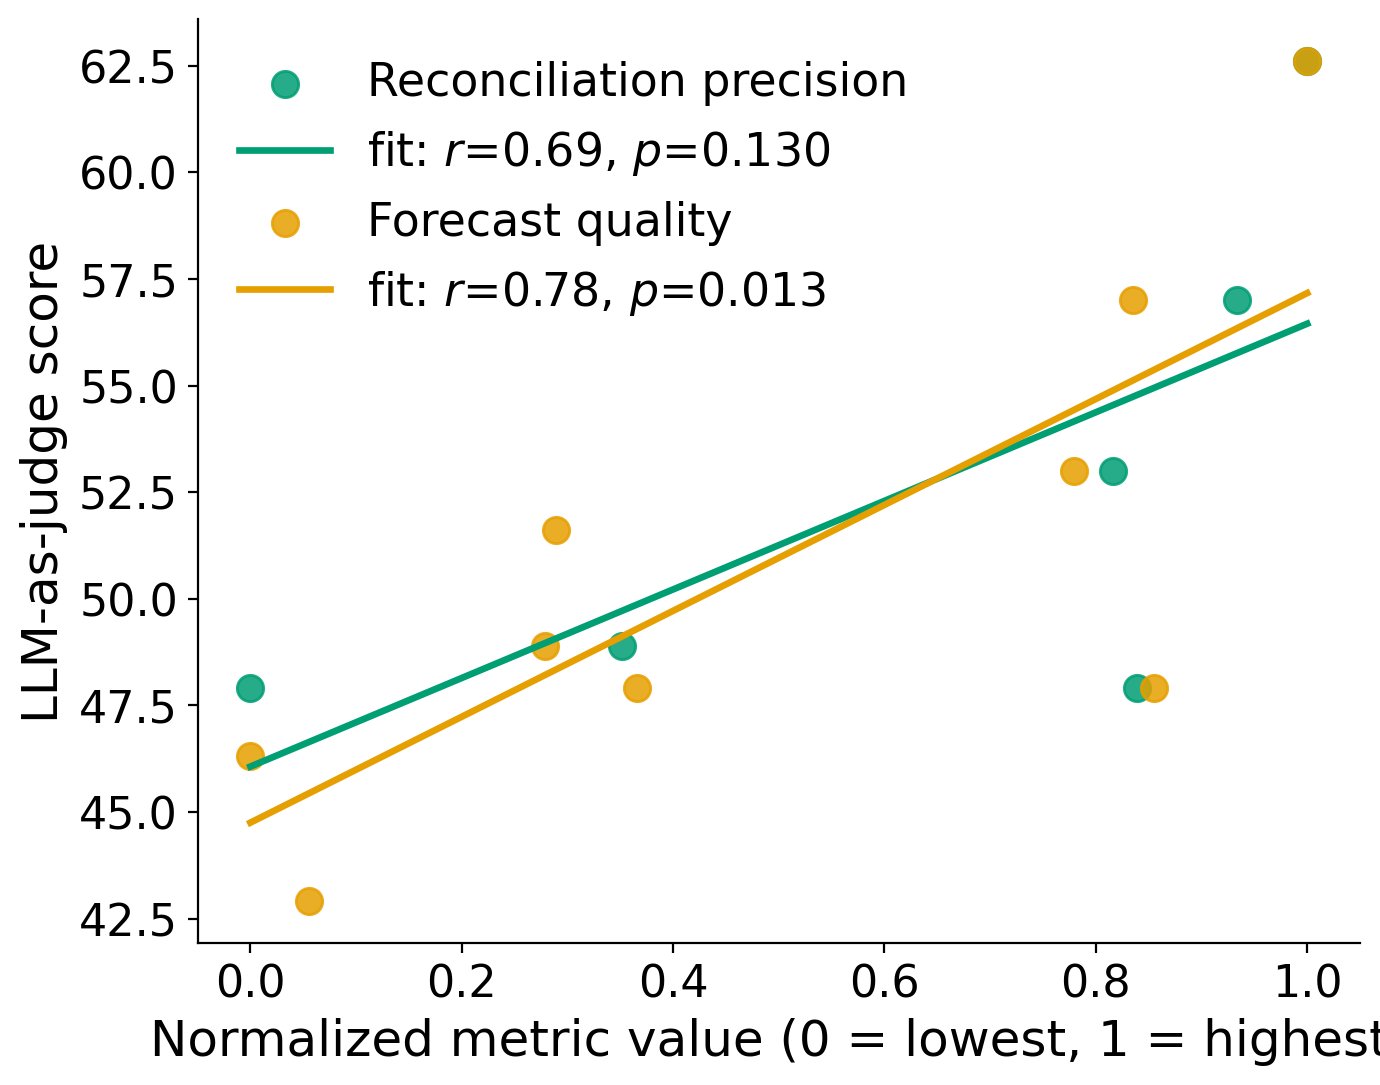
The conditions move the intermediate metrics but not the verdict, so we ask what the verdict tracks. We treat each model, condition, and deal as one observation, standardize the predictors, and regress the judge score on the five stage metrics.
Association of each stage metric with the judge score, over all model, condition, and deal observations, with predictors and judge standardized, n = 109.
Forecast quality dominates, with a standardized coefficient of 0.75 and a univariate correlation of 0.83, far above extraction at 0.28, grounding at 0.15, and reconciliation at 0.08; risk propagation is not significant. Almost all variation in the judged recommendation tracks one stage, the forecast.
What the verdict depends on
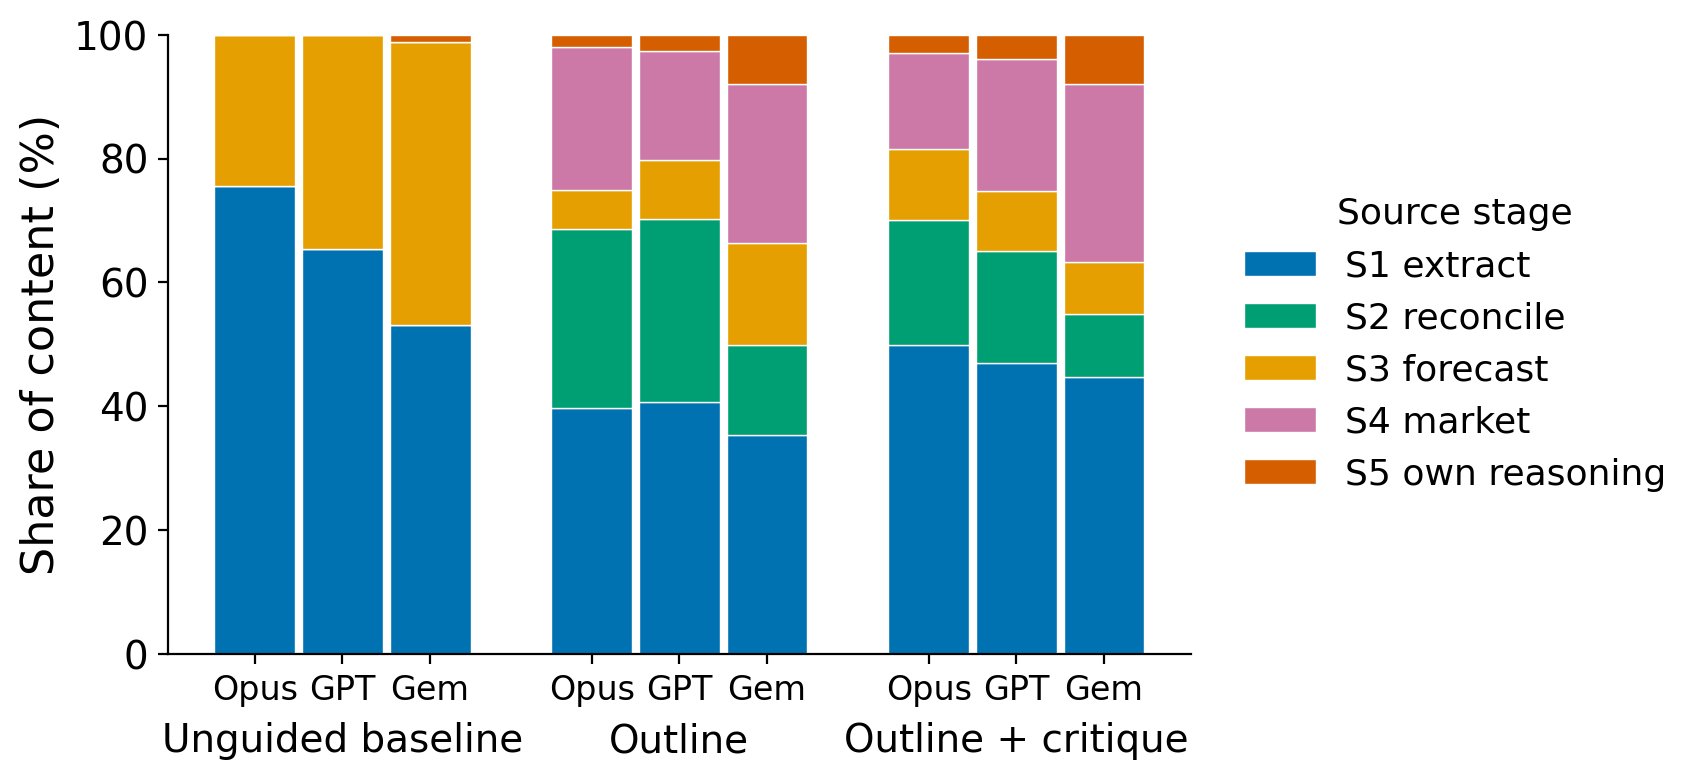
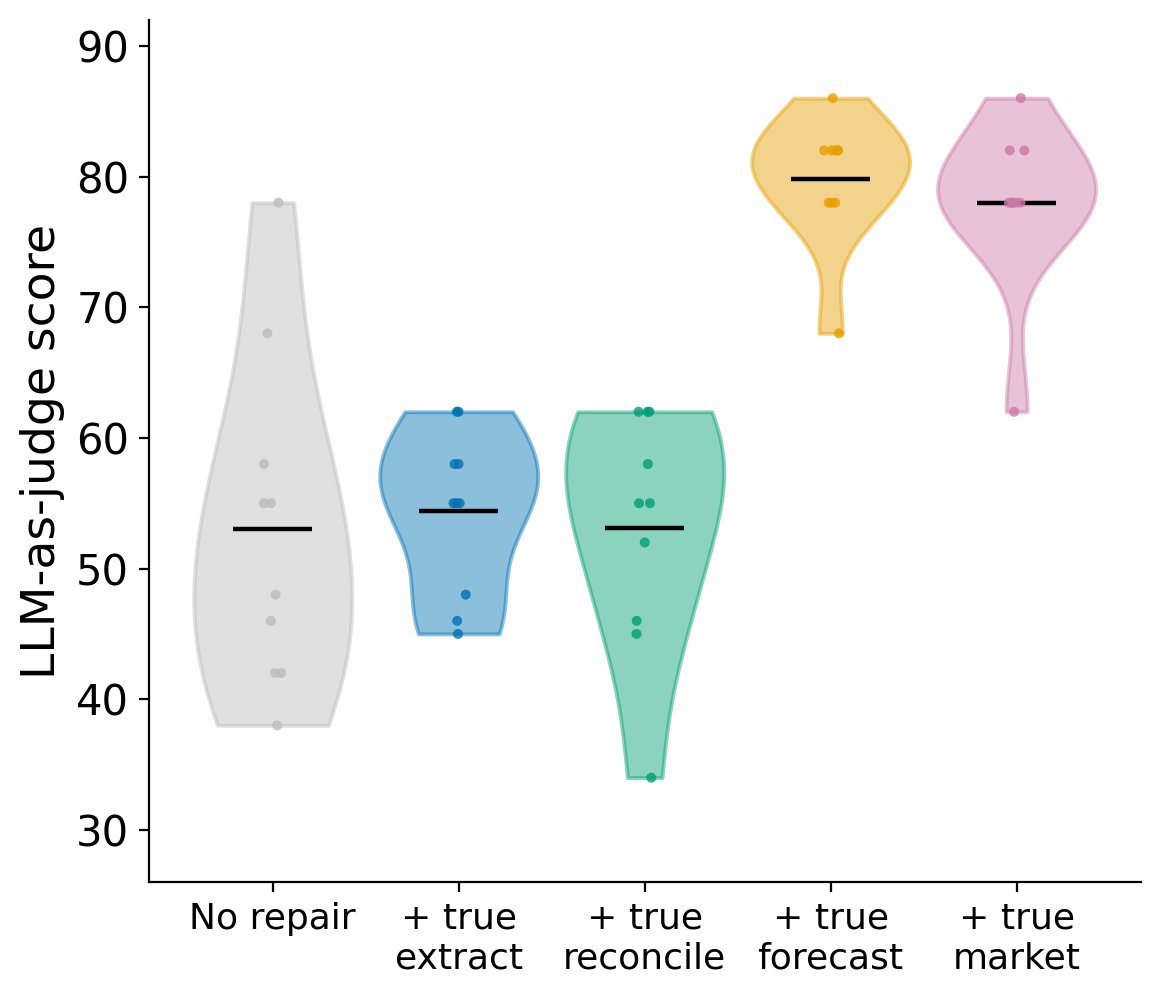
The regression shows forecasting correlates with the verdict; the interventions show it drives it. In the repair chain, supplying the true extraction moves the judge score by +1.4 and the true reconciliation by −1.3, so the early stages account for almost none of the gap, while the true forecast lifts it by almost 27 points, from 53 to 80. The provenance composition agrees: what a recommendation cites shifts with scaffolding, adding reconciliation and market evidence under an outline, but forecasting is present in every condition.
The trace also makes a process failure measurable. During reconciliation, models catch discrepancies between the narrative and the model precisely, near 90 percent, for instance a memo claiming 22 percent growth where the workbook supports 14. But a flagged discrepancy is carried into the recommendation only 7 to 29 percent of the time, measured by the risk-propagation column of the deterministic scorecard, the share of flagged findings that resurface in the recommendation. The skepticism is computed at reconciliation and dropped before the recommendation.
What scaffolding changes
Varying the scaffolding splits cleanly: the gradable stages move and the verdict does not. Forecast coverage rises from 14 to 30 percent unguided to 71 to 88 percent under an outline, targeted forecast accuracy from below 8 percent to about 35 percent for all three models, and reconciliation precision, absent unguided because the baseline emits no gradable citations, reaches near 90 percent once there is a schema. The critic pass is the exception: it does not reliably raise the judge score, lowers it for Opus from 53.0 to 47.9, and roughly doubles cost.
The implication is specific. Scaffolding's gains accrue to the intermediate, checkable stages a schema can enforce, and do not convert into a better recommendation, because the recommendation is gated by forecasting, which prompting does not supply. The critic, the usual first response to weak output, is not a safe default: on the strongest model it lowers the score at roughly twice the cost. Improving the verdict requires improving forecasting, a matter of training and tool use rather than prompting.
Masked forecasting
Where most work has ground truth, it is spent on a single use, scoring direct accuracy. We make fuller use of it. The masked forecast, together with the interventions, is how we exploit the task, drawing on everything known about each deal to look past a single number into how a model actually performs, and forecasting is where that effort pays off, since it is the stage the entire verdict turns on. The projection is leakage-resistant by construction: the whole forecast region is masked, so the answer cannot be retrieved, only reconstructed, and a masked total cannot be recovered by summing the visible components. Models are scored on a fixed canonical grid, the same fields over the same horizon for every deal, so an error on one deal is commensurable with the same error on another.
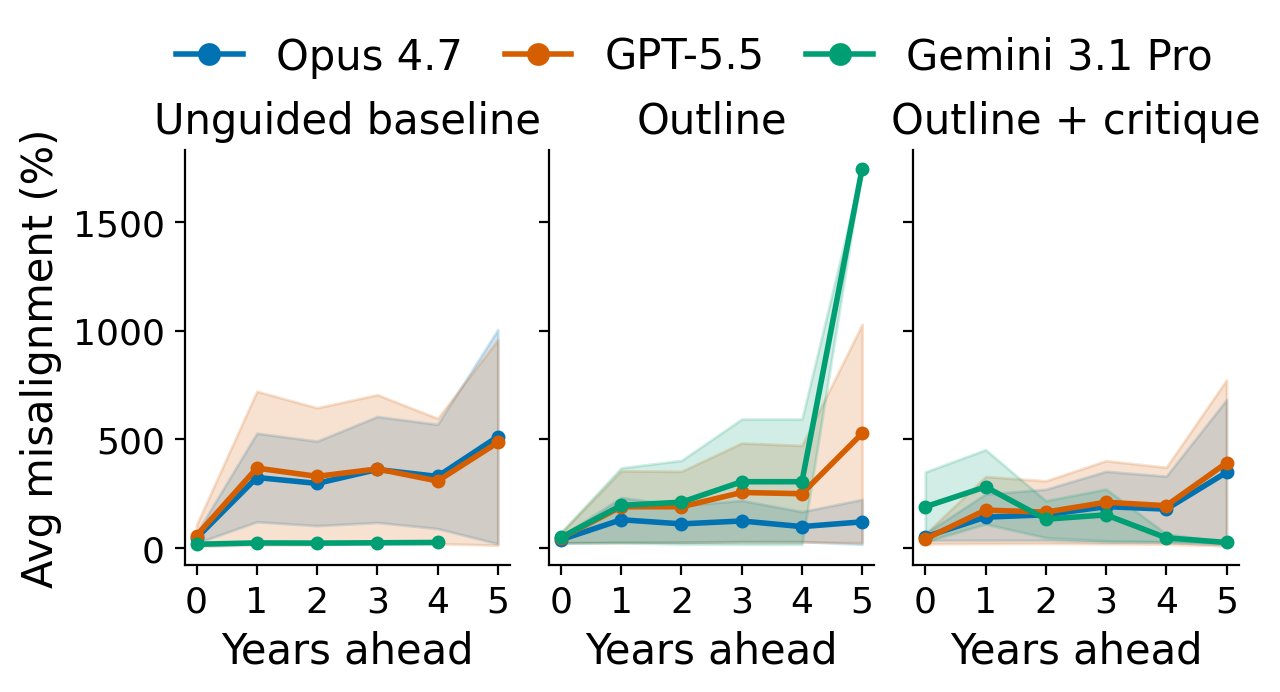
The informative result is the error's shape, not its level. Average misalignment is large and heavy-tailed: predicted cells are often off by a wide margin, which is how coverage reaches the eighties while the forecast stays unreliable. The error also grows with the horizon. Near periods, supported by visible historicals, are reconstructed well, and accuracy falls as the model projects further, where the task requires forward reasoning rather than interpolation.
Explore the runs
The comparison below places GPT-5.5, the strongest model in this evaluation, alongside Gemini 3.1 Pro, the weakest, both running under the outline-plus-critique condition on the same deal. As the results above show, forecast quality is the stage that most separates the two models: GPT-5.5 rebuilds the masked forecast grid accurately while Gemini's forecast falls apart. The excerpt shows each model's Stage 5 recommendation, where citation chips let you retrace each claim back through the upstream stages to the source document. Click a chip to see the stage it came from and whether the claim was graded correct or incorrect.
Conclusion
The recommendation comes down to the forecast. Models are strong on the stages that can be checked against a source, locating figures, reconciling the narrative against the model, and citing what they assert, and weak on the one stage that requires projecting forward; and because every later stage rests on that forecast, it is the forecast that sets the verdict. Scaffolding moves the checkable stages without moving the verdict, a single self-critique pass can cost more than it returns, and, most tellingly, the models compute the risks that should temper a recommendation and then discard them before the verdict is reached. A staged, provenance-traced evaluation is what makes each of these visible.
Discussion and future work
What we find most interesting is the set of patterns underneath the headline result. Forecast guidance and reasoning scaffolding both exert a clear, positive effect on the checkable stages, even where they leave the final verdict unchanged, which is itself worth dwelling on. Performance is also not uniform across models: the three frontier systems do not fail in the same way, and Gemini in particular exhibits a forecasting pattern that comes apart from the others, its misalignment blowing out at the far end of the horizon where the other two remain comparatively flat, as the misalignment figure above shows. The effect of the outline-plus-critique pass is similarly non-uniform, modestly helping one model and hurting another, so it is not a setting with a single answer. Each of these is a thread worth pulling, and the staged, intervenable harness is built to pull them.